Kappa
“Great things are not done by impulse, but by a series of small things brought together.”
Hack The Box
K-Means Clustering
K-means clustering is a popular unsupervised learning algorithm for partitioning a dataset into K distinct, non-overlapping clusters. The goal is to group similar data points, where similarity is typically measured by the distance between data points in a multi-dimensional space.
Imagine you have a dataset of customers with information about their purchase history, demographics, and browsing activity. K-means clustering can group these customers into distinct segments based on their similarities. This can be valuable for targeted marketing, personalized recommendations, and customer relationship management.
K-means is an iterative algorithm that aims to minimize the variance within each cluster. This means it tries to group data points so that the points within a cluster are as close to each other and as far from data points in other clusters as possible.
The algorithm follows these steps:
- Initialization: - Randomly select K data points from the dataset as the initial cluster centers (centroids). These centroids represent the average point within each cluster.
- Assignment: - Assign each data point to the nearest cluster center based on a distance metric, such as Euclidean distance.
- Update: - Recalculate the cluster centers by taking the mean of all data points assigned to each cluster. This updates the centroid to represent the center of the cluster better.
- Iteration: - Repeat steps 2 and 3 until the cluster centers no longer change significantly or a maximum number of iterations is reached. This iterative process refines the clusters until they stabilize.
Euclidean Distance
Euclidean distance is a common distance metric used to measure the similarity between data points in K-means clustering. It calculates the straight-line distance between two points in a multi-dimensional space.
For two data points x and y with n features, the Euclidean distance is calculated as:
          d(x, y) = sqrt(Σ (xi - yi)^2)

          Where:
            xi and yi are the values of the i-th feature for data points x and y, respectively.
Choosing the Optimal K
Determining the optimal number of clusters (K) is crucial in K-means clustering. The choice of K significantly impacts the clustering results and their interpretability. Selecting too few clusters can lead to overly broad groupings, while selecting too many can result in overly granular and potentially meaningless clusters.
Unfortunately, there is no one-size-fits-all method for determining the optimal K. It often involves a combination of techniques and domain expertise.
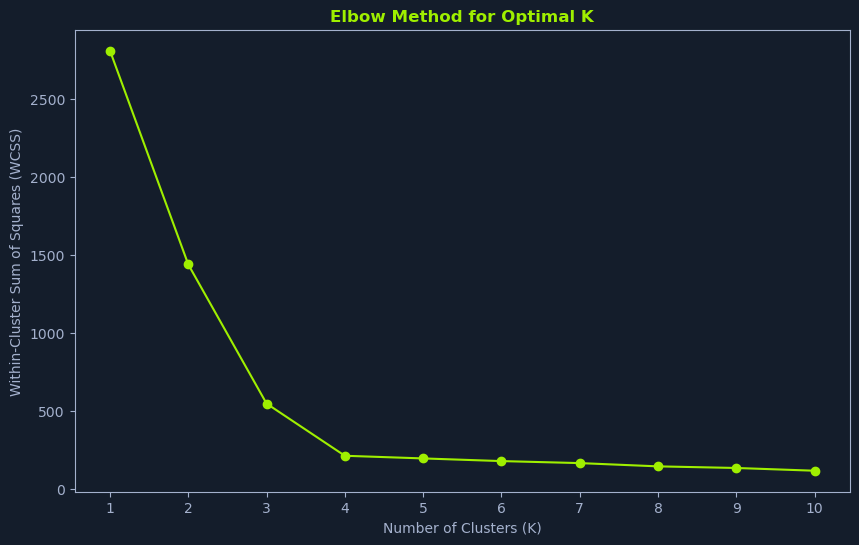
Elbow Method
The Elbow Method is a graphical technique that helps estimate the optimal K by visualizing the relationship between the number of clusters and the within-cluster sum of squares (WCSS).
It follows the following steps:
- Run K-means for a range of K values: - Perform K-means clustering for different values of K, typically starting from 1 and increasing incrementally.
- Calculate WCSS: - For each value of K, calculate the WCSS. The WCSS measures the total variance within each cluster. Lower WCSS values indicate that the data points within clusters are more similar.
- Plot WCSS vs. K: - Plot the WCSS values against the corresponding K values.
- Identify the Elbow Point: - Look for the "elbow" point in the plot. This is where the WCSS starts to decrease at a slower rate. This point often suggests a good value for K, indicating a balance between minimizing within-cluster variance and avoiding excessive granularity.
The elbow point represents a trade-off between model complexity and model fit. Increasing K beyond the elbow point might lead to overfitting, where the model captures noise in the data rather than meaningful patterns.
Silhouette Analysis
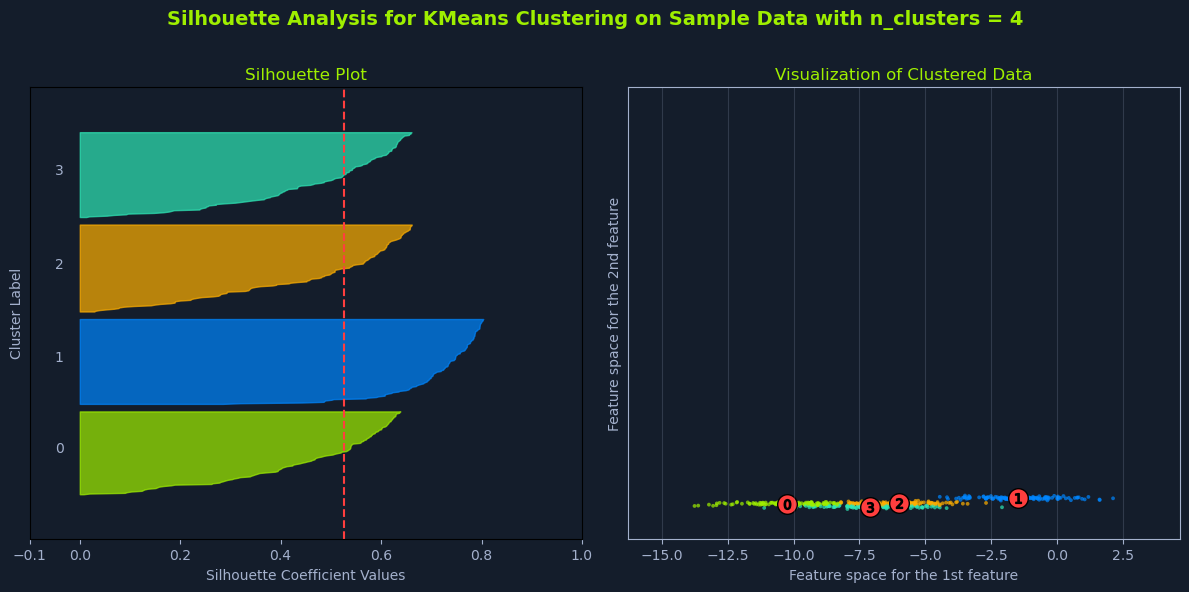
Silhouette analysis provides a more quantitative approach to evaluating different values of K. It measures how similar a data point is to its own cluster compared to others.
The process is broken down into four core steps:
- Run K-means for a range of K values: - Similar to the elbow method, perform K-means clustering for different values of K.
- Calculate Silhouette Scores: - For each data point, calculate its silhouette score. The silhouette score ranges from -1 to 1, where:
- A score close to 1 indicates that the data point is well-matched to its cluster and poorly matched to neighboring clusters.
- A score close to 0 indicates that the data point is on or very close to the decision boundary between two neighboring clusters.
- A score close to -1 indicates that the data point is probably assigned to the wrong cluster.
- Calculate Average Silhouette Score: - For each value of K, calculate the average silhouette score across all data points.
- Choose K with the Highest Score: - Select the value of K that yields the highest average silhouette score. This indicates the clustering solution with the best-defined clusters.
Higher silhouette scores generally indicate better-defined clusters, where data points are more similar to their cluster and less similar to others.
Domain Expertise and Other Considerations
While the elbow method and silhouette analysis provide valuable guidance, domain expertise is often crucial in choosing the optimal K. Consider the problem's specific context and the desired level of granularity in the clusters.
In some cases, practical considerations might outweigh purely quantitative measures. For instance, if the goal is to segment customers for targeted marketing, you might choose a K that aligns with the number of distinct marketing campaigns you can realistically manage.
Other factors to consider include:
- Computational Cost: - Higher values of K generally require more computational resources.
- Interpretability: - The resulting clusters should be meaningful and interpretable in the context of the problem.
By combining these techniques and considering the task's specific requirements, you can effectively choose an optimal K for K-means clustering that yields meaningful and insightful results.
Data Assumptions
K-means clustering makes certain assumptions about the data:
- Cluster Shape: - It assumes that clusters are spherical and have similar sizes. This means it might not perform well if the clusters have complex shapes or vary significantly in size.
- Feature Scale: - It is sensitive to the scale of the features. Features with larger scales can have a greater influence on the clustering results. Therefore, it's important to standardize or normalize the data before applying K-means.
- Outliers: - K-means can be sensitive to outliers, data points that deviate significantly from the norm. Outliers can distort the cluster centers and affect the clustering results.